General
Getting Started
Learn about the most common features offered in ICE XL, with how-to guides and examples for each of the following tools; Quote Table, Data Points, Time Series, Time and Sales and Options.
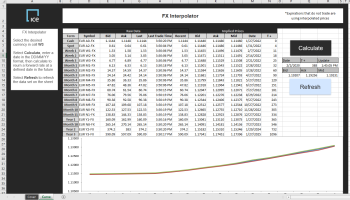
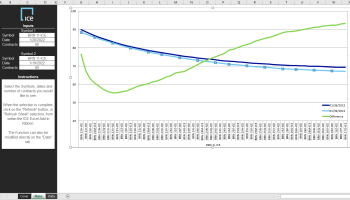
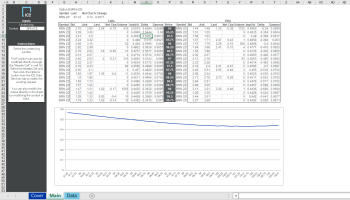
FX Interpolator
Use this prebuilt FX interpolator to provide FX forward rates at specified dates in the future. Macro enabled workbook.
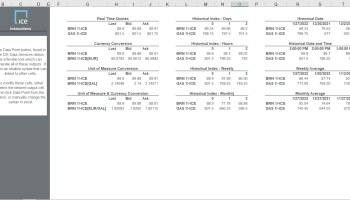
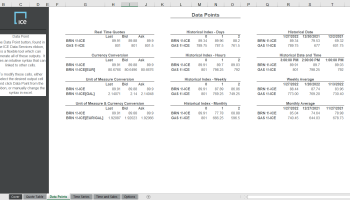
Data Point
The Datapoint template showcases some of the flexibility within the application. From monthly averages to unit and currency conversion, the Add In can output nearly any request into a single cell.
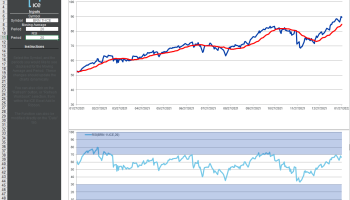
Formula
Dynamically change technical indicators in the formula chart in Excel. Formulas can be used for simple cracks and spreads, as well as advanced statistical functions.
Time Series
Retrieve deep Daily, or intraday history directly into excel. Advanced parameters for removing weekends, holidays, and advanced fill mechanics to manage disparate datasets.
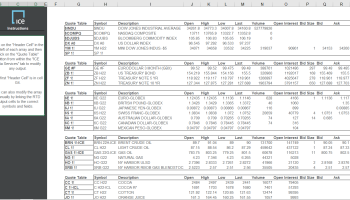
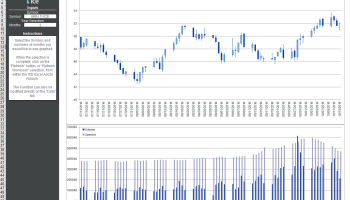
Quote Table
Output a flexible array of live data. The Quote table is easy to generate or modify, either directly in Excel or through our advanced Add In windows.
Commodities
Forward Curve
Plot the forward curve of any future on a selection of days. The Forward curve tool is flexible for both outright futures as well as expressions and spreads.
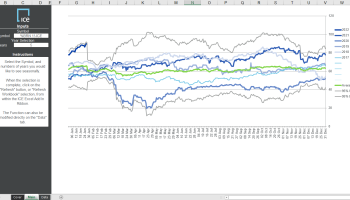
Seasonality
View the historical data year-over-year in this seasonality output. Our seasonality functionality allows for rolling years, distinct ranges in time, and even intraday seasonality which outputs day-over-day.
Volatility Skew
The Options window generates a dynamic options board directly in Excel. The strike prices and expirations update dynamically and allow the user to create robust analytical sheets with definable Black-Scholes parameters.
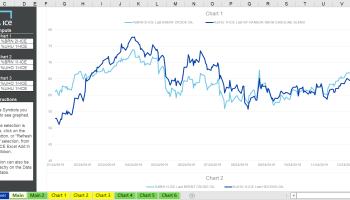
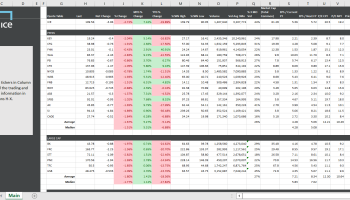
Crude Overview
Easily access crude and related products in this overview template. Charts can be easily modified within the main toolbar.
Equities
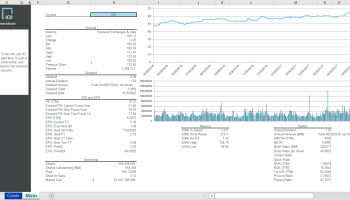
Single Stock
Analyze equity fundamentals and price history for a single stock security in this dynamic Excel workbook.
Multiple Stock
Compare multiple stock prices and fundamentals in a dynamically updating Excel workbook.
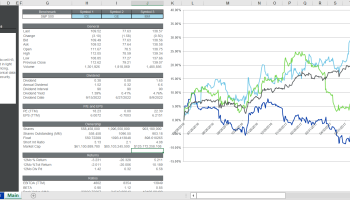
Bank Financials
Compare your stock vs peers and other symbols in the Financial Sector in this easily customizable template.
Fixed Income

Continuous Evaluated Pricing (CEP)
Continuous Fixed Income Evaluated Pricing extends our industry leading end-of-day evaluations to intraday by using market information to create a continuous evaluated price. Our innovative approach combines both quantitative and qualitative assessments, overseen by our global evaluation team, to generate an independent, continuous stream of fixed income evaluations that can be used to support trading, transaction cost analysis, and best execution.
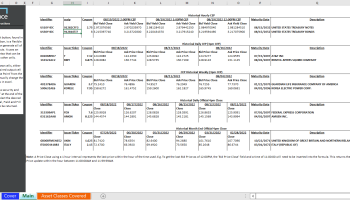
Continuous Evaluated Pricing (CEP) History
Continuous Fixed Income Evaluated Pricing extends our industry leading end-of-day evaluations to intraday by using market information to create a continuous evaluated price. Output a specific request into a single cell using this easily customizable Data Point Template to retrieve historical point in time intraday data.
QuoteBoard
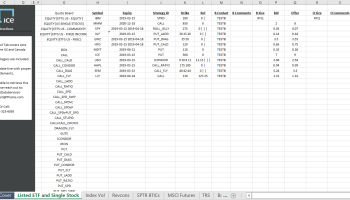
Customized Equity Derivatives Data
QuoteBoard is the leading global pre-trade price discovery platform used by 80+ brokers and 130+ banks and trading houses to post and respond to ‘Indications of Interest’ (IOIs) in respect of listed and OTC equity derivatives. This template was created to help traders source customized data from QuoteBoard for the U.S. Equity Derivatives markets.
Weather
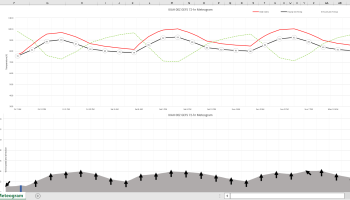
Meteogram
A Meteogram shows the evolution of multiple weather parameters over time. This allows for comprehensive weather information, like temperature, wind, clouds, and precipitation, from one source. Sources and locations are selectable.
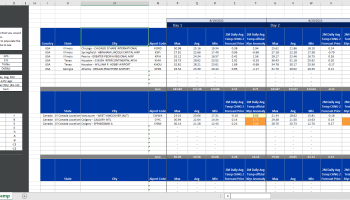
Real-Time Data Access
This template is designed to access the raw weather forecast data for all locations inside Connect. This spreadsheet is constructed in a manner to quickly add locations which will then display the daily average temp, max temp, min temp, GWDD, HDD, CDD as well as forecast model changes, from prior model runs.
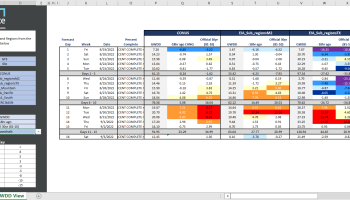
Real-Time Monitor
This template is designed to access the raw weather forecast data for all locations inside Connect. This spreadsheet is constructed in a manner to quickly add locations which will then display the daily average temp, max temp, min temp, GWDD, HDD, CDD as well as forecast model changes, from prior model runs.
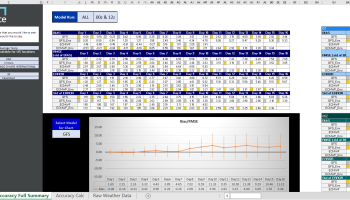
Weather Forecast Accuracy
This Excel spreadsheet allows a user to quickly & easily monitor the ever changing, weather forecast accuracy from the four (4) primary government weather models (GFS, GEFS, ECM, ECE) and all their respective model runs. Using an interactive “analysis window” quickly understand which weather models are performing the best, for ‘each’ forecast day 1-16, for any specific location or region. Quickly switch Forecast Parameters between temperatures and GWDD to understand which forecast is most likely to be correct.
FactSet
Cash Flow
Displays detailed cash flow statements, including operating, investing, and financing activities, to analyze liquidity and cash generation trends.
Balance Sheet
Provides a snapshot of assets, liabilities, and equity to assess financial position and capital structure.