Parameters
There are different parameters to help customize your Formula Time Series output. You can access this dialog by clicking the Parameters button on the main Formula window.
Time Tab
From / To
| Range | Select to choose a period of time |
| Date | Select to choose a specific date |
| Now | Select to choose current day/time |
| Automatic Refresh | When enabled this allows the sheet to always display the most up-to-date values and dates of the selection |
| Output Granularity | Interval of time series data. Options are seconds, minutes, hours, days, weeks, weekly average, months, and monthly average. |
| Seasonality | Option to display data seasonally. This option stacks daily and greater granularities year-over-year, with intraday data stacked day-over-day. |
Filter
| Months | Select if you want to further customize your time series to omit months |
| Days | Select if you want to further customize your time series to omit months |
Data Tab
Fill
| Forward | Fill’s previous days data forward until there is another price available |
| End | Fills previous days data forward until the end of the selected time series |
| Backward | Fill’s data backwards until there is another price available |
| Interpolate | Creates synthetic values for a span of NaN values based on the last known value and the next known value by creating linear interpolated values between them. |
| Fill NA | Fills blank cells with =NA() function which generates “#N/A” error message in cells to be ignored by charts. |
| None | No Fill is applied and weekends and holidays are empty |
Time Line
| Union | Shows days when any of the selected datasets have a value |
| Intersection | Shows days when all of the selected datasets have a value |
| Leftmost | Shows days when the initial selection has a value |
| Calendar | Shows all days (default selection) |
Data Output
| Live Updates | Will generate a live RTD function that will return data without the need to refresh the sheet |
| Download Values | Will return the current values of the request. Refresh options are used in order to update these values |
Date Type
| Exchange Time | For some symbols you can set the Date type to Exchange time, which returns the Date/Time it was received |
| Interval Start | For some symbols you can set the Date type to Interval Start, which returns the beginning of the Date/Time that the value is referencing |
| Interval End | For some symbols you can set the Date type to Interval End, which returns the End of the Date/Time that the value is referencing |
Output Tab
Sort
| Ascending | Data will be filled to the worksheet in ascending order |
| Descending | Data will be filled to the worksheet in descending order |
Plot
| Vertical | Fields will displayed vertically as rows |
| Horizontal | Fields will be displayed horizontally as columns |
| Show Symbol Description | Select to have Symbol Description as part of the time series output |
| Delivery | Select to have the Delivery as part of the time series output |
| Symbol | Select to have the underlying symbol as part of the time series output |
| Merge Symbol Headers | Merges cells with common symbol headers in the symbol array |
| Use Reference | Select Checkbox to build your Time Series with Cell References versus hard-coded symbols/fields. |
| Format Numbers | Sets the decimal formatting in the output - this does not truncate the values. |
Destination Options
| Title | The label to display in the cell which contains the Time Series Function |
| Output Cell | Sets a destination output cell for placing the output array. Cell selected will be top left element in array output. |
| Output Array | Clears a range set by user before refresh. |
Input Example
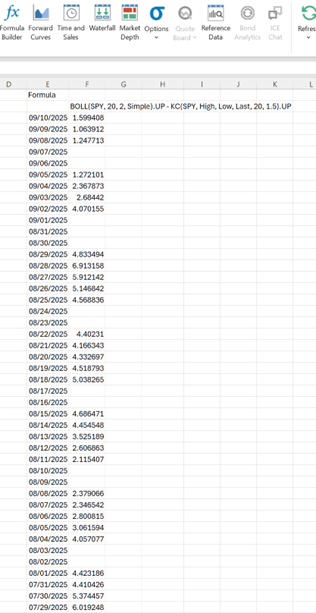
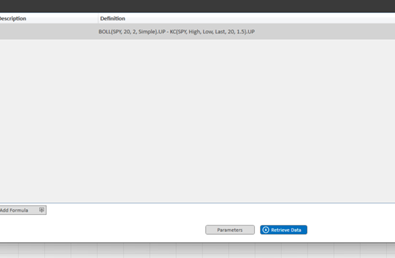
Here is a typical formula that replicates the TTM Squeeze indicator. (The TTM Squeeze indicator is triggered when the Bollinger Bands become contained within the Keltner Channel).
Output Example