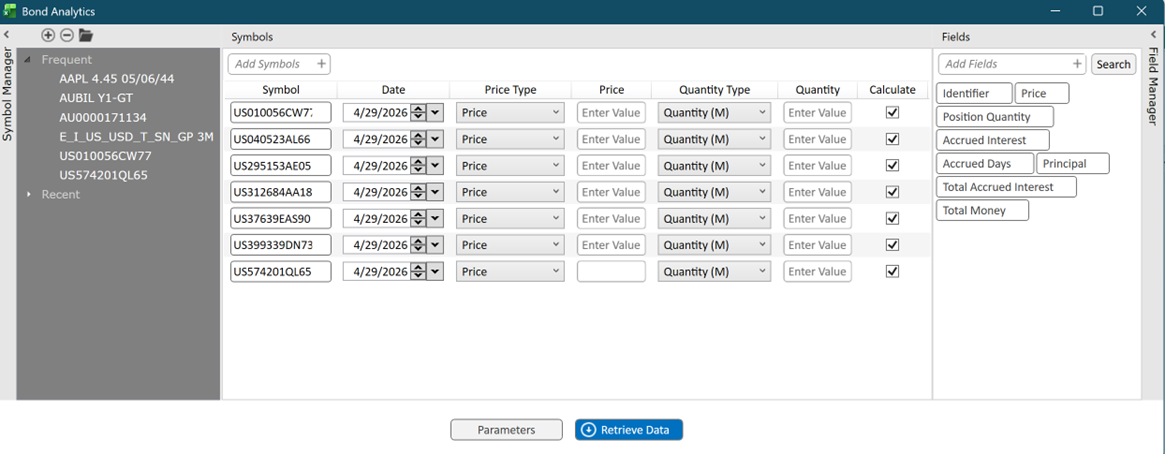
Bond Analytics User Interface
| Symbols | Symbols selected to be added to the Bond Analytics table. |
| Add Symbols | Enter symbols to be added. Click the search icon to access the symbol search dialog. |
| Date | Set the as-of date for the analytics calculation. |
| Price Type | Select the price type used for calculation: Price, Yield to Worst, or Yield to Maturity. |
| Price | Enter the value used in calculations. If left blank, the system applies the End-of-Day evaluated price, or par value if no EOD price is available. |
| Quantity Type | Select the quantity convention: Quantity (M) — entered value interpreted as multiples of 1,000; Quantity (Actual) — entered value taken as provided. |
| Quantity | Enter the quantity to be used in calculations. Defaults to 1,000 if left blank. |
| Calculate | Toggle to include or exclude individual rows from the calculation set. |
| Fields | Fields selected to be added to the Bond Analytics table. Multiple fields are separated by comma. |
| Add Fields | Select Add Fields to access the list of fields available for Bond Analytics. |
| Parameters | Select Parameters to access user-customized options for your Bond Analytics table. |
| Retrieve Data | Select Retrieve Data to execute and build your Bond Analytics table within your Excel sheet. |
| Symbol Manager | Select Symbol Manager to expand your library of saved and recently accessed symbols. |
| Field Manager | Select Field Manager to expand your library of saved field groups. |