Purpose
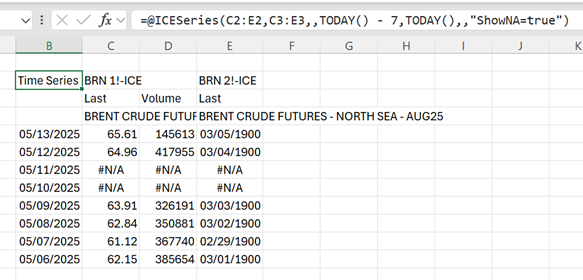
The Time Series generates streaming or snapshot arrays of time point data over a series of dates with custom fields and parameters. As with most ICE XL features, each Time Series cell operates as a function in Excel. Once the data has been generated in the cells, all Excel features (functions, calculations, graphs, charts, etc.) can be utilized.
OUTPUT:
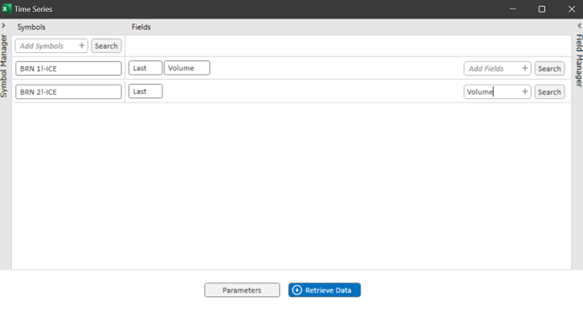
Time Series User Interface
| Symbols | Symbols selected to be added to the Time Series Table. |
| Add Symbols | Enter symbols to be added and click , you can click the to access symbol search dialog |
| Fields | Fields selected to be added to the Time Series table. Multiple fields are separated by comma. |
| Add Fields | Select Add Fields to add access a list of field available for the Time Series |
| Parameters | Select Parameters to access user customized options for your Time Series Table |
| Retrieve Data | Select Retrieve Data to execute and build your Time Series Table within your Excel sheet |
| Symbol Manager | Select Symbol Manager to expand your library of saved and recently accessed symbols |
| Field Manager | Select Field Manager to expand your library of saved field groups |